FLOODING HAZARDS
Pierce County transit routes measured as a percentage of vulnerability in the event of severe flooding. Routes at the highest risk of flooding (20-40% chance) are highlighted in red, the least at risk (0.5-10% chance) are highlighted in green, all others fall between these two risk values. As it holds a disproportionate amount of the total Pierce County transit routes, the city of Tacoma is the primary focus.
Primary data was sourced from Pierce County Open GeoSpatial Data Portal
and Washington GeoSpatial Open Data Portal

In Figure 1, this perspective of Pierce County's transit flooding risks focus primarily on the greater Tacoma area. The majority of Tacoma's north and south end have less than a 10% hazard of some portion of the line being covered in a severe flood event.
Figure 1
The further away from the north and south end of Tacoma you travel, especially travelling east, the higher the risk for transit lines to affected by flooding becomes. Figure 2 shows the strict boundaries of flooding risk that occur between downtown Tacoma and the Puyallup Tideflats, where a majority of the city's industry exists.
Figure 4 Figure 5

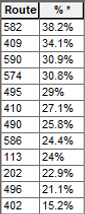
Figure 3

The map legend, as shown in Figure 3, provides a key of transit lines that are at highest percentage of coverage risk in a sever flooding event. The degrees of separation are between 0.5% to 40% flooding coverage.
Figure 4 and 5 are table data attributed to the map, where the table color and percentage of risk corresponds with the Legend colors provided in Figure 3. The "Route" column simply lists the Pierce County bus routes at risk.
